What is the use of indicators like RSI and MACD? || आरएसआई और एमएसीडी जैसे संकेतकों का क्या उपयोग है?
What is the use of indicators like RSI and MACD?
A good question!
RSI and MACD are the two popular momentum indicators in the trading community.
RSI - The RSI calculates average price gains and losses over a given period of time. Usually, default time period is set to14 periods. RSI values are plotted on a scale from 0 to 100.
MACD - The MACD is primarily used to gauge the strength of the stock price movement. The MACD is calculated by subtracting the 26-period Exponential Moving Average (EMA) from the 12-period EMA. The result of that calculation is the MACD line. A nine-day EMA of the MACD called the "signal line," is then plotted on top of the MACD line, which can function as a trigger for buy and sell signals.
The MACD measures the relationship between two EMAs, while the RSI measures price change in relation to recent price highs and lows.
I have not explored much on MACD. However, I have studied RSI for many years. Hence, I will explain only RSI from a practical application perspective.
RSI can be used in two ways:
To identify the Trend/Change in Trend
To identify hidden divergences which gives a good trade entry
Identify the “Trend/Change in Trend” using RSI
Image - RSI zone which explains the trend
The above image explains the right way of using RSI.
When the RSI value is above 60, usually the price will be in the uptrend;
when RSI is below 40, the price will be in the downtrend and
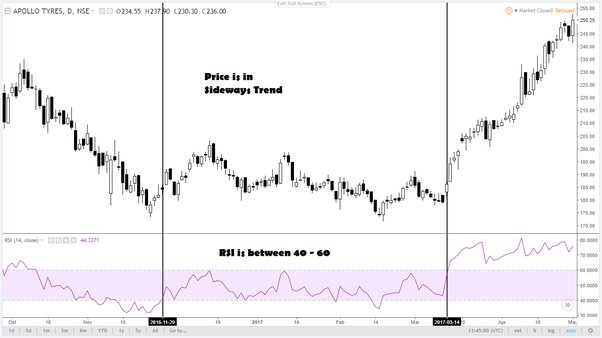
when the RSI is in between 40-60, the price will be in sideways zone.
Look at the examples to get a clear understanding:
Image - INFOSYS chart showing downtrend when the RSI is below 40
.
Image - RELIANCE chart showing uptrend when the RSI is above 60
.
Image - APOLLO TYRE chart showing sideways trend when the RSI is 40-60
This concept is applicable to all timeframe charts. The moment RSI breaks 60, the price will be in an uptrend until RSI breaks 60 again. When RSI is in between 40-60, it will show sideways movement and the moment it breaks 40, the downtrend will starts.
Identify the “Hidden Divergences” using RSI
RSI Hidden divergences (Bullish and Bearish) are the best way to make trades because of the below reasons:
- Trades will be in the direction of the trend
- The success ratio is better as compared to conventional RSI divergence
- Good Risk-Reward as a trend can continue at higher levels.
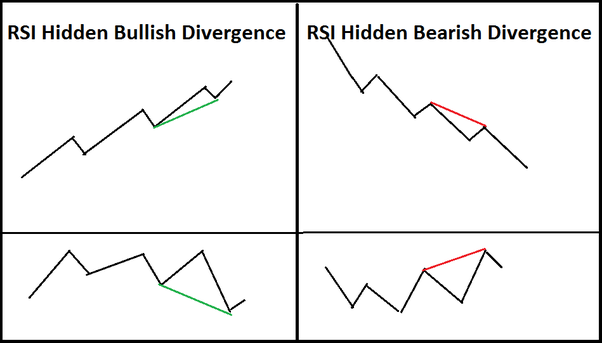
Image - RSI Hidden Bullish and Bearish Divergences
The above image shows the formation of both Hidden Bullish and Hidden Bearish Divergences.
We can see some charts which show these hidden divergences and we will also see the results.
Image - Maruti chart showing Hidden bullish divergence
.
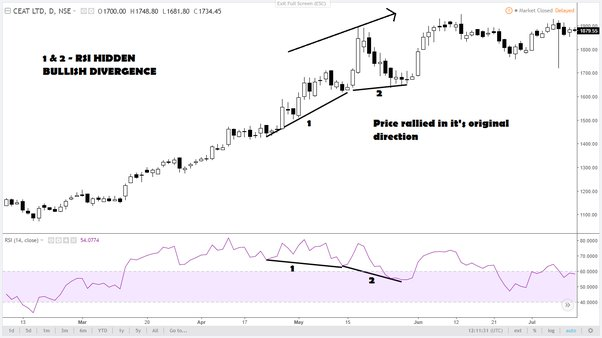
Image - Ceat Ltd chart showing Hidden Bullish Divergence
.
Image - Nifty chart showing Hidden Bearish Divergence
.
Image - Yesbank chart showing Hidden Bearish Divergence
.
If you look at all the above charts, hidden divergences occur in the direction of the trend. Taking trades after hidden divergence is a good idea (in addition to any other confirmation like candlestick confirmation or MA confirmation etc) than taking trades on the normal divergences.
I hope this detailed explanation helps!
आरएसआई और एमएसीडी जैसे संकेतकों का क्या उपयोग है?
अच्छा सवाल है!
ट्रेडिंग समुदाय में आरएसआई और एमएसीडी दो लोकप्रिय गति संकेतक हैं।
आरएसआई - आरएसआई एक निश्चित अवधि में औसत मूल्य लाभ और हानि की गणना करता है। आमतौर पर, डिफ़ॉल्ट समय अवधि 14 अवधियों पर सेट होती है। RSI मान 0 से 100 के पैमाने पर प्लॉट किए जाते हैं।
एमएसीडी - एमएसीडी मुख्य रूप से स्टॉक मूल्य आंदोलन की ताकत को मापने के लिए प्रयोग किया जाता है। एमएसीडी की गणना 12-अवधि के ईएमए से 26-अवधि के घातीय मूविंग एवरेज (ईएमए) को घटाकर की जाती है। उस गणना का नतीजा एमएसीडी लाइन है। एमएसीडी के नौ दिवसीय ईएमए को "सिग्नल लाइन" कहा जाता है, फिर एमएसीडी लाइन के शीर्ष पर प्लॉट किया जाता है, जो संकेतों को खरीदने और बेचने के लिए ट्रिगर के रूप में कार्य कर सकता है।
एमएसीडी दो ईएमए के बीच संबंध को मापता है, जबकि आरएसआई हाल के मूल्य उच्च और चढ़ाव के संबंध में मूल्य परिवर्तन को मापता है।
मैंने एमएसीडी पर ज्यादा खोजबीन नहीं की है। हालाँकि, मैंने कई वर्षों तक RSI का अध्ययन किया है। इसलिए, मैं केवल आरएसआई को व्यावहारिक अनुप्रयोग के दृष्टिकोण से समझाऊंगा।
RSI का दो तरह से उपयोग किया जा सकता है:
रूझान/प्रवृत्ति में परिवर्तन की पहचान करने के लिए
छिपे हुए विचलन की पहचान करने के लिए जो एक अच्छी व्यापार प्रविष्टि देता है
RSI का उपयोग करके "रुझान/परिवर्तन में रुझान" की पहचान करें
छवि - आरएसआई क्षेत्र जो प्रवृत्ति की व्याख्या करता है
ऊपर दी गई छवि आरएसआई का उपयोग करने का सही तरीका बताती है।
जब RSI मान 60 से ऊपर होता है, तो आमतौर पर कीमत ऊपर की ओर होती है;
जब RSI 40 से नीचे होता है, तो कीमत डाउनट्रेंड में होगी और
जब RSI 40-60 के बीच होता है, तो कीमत साइडवेज ज़ोन में होगी।
स्पष्ट समझ पाने के लिए उदाहरण देखें:
इमेज - जब आरएसआई 40 से नीचे हो तो इंफोसिस चार्ट डाउनट्रेंड दिखा रहा है
छवि - रिलायंस चार्ट आरएसआई 60 से ऊपर होने पर अपट्रेंड दिखा रहा है
.छवि - आरएसआई 40-60 होने पर अपोलो टायर चार्ट क्षैतिज प्रवृत्ति दिखा रहा है
यह अवधारणा सभी टाइमफ्रेम चार्ट पर लागू होती है। जिस क्षण आरएसआई 60 टूटता है, कीमत तब तक ऊपर की ओर रहेगी जब तक कि आरएसआई 60 फिर से टूट न जाए। जब RSI 40-60 के बीच में होता है, तो यह साइडवेज मूवमेंट दिखाएगा और जैसे ही यह 40 टूटता है, डाउनट्रेंड शुरू हो जाएगा।
RSI का उपयोग करके "छिपे हुए अंतर" को पहचानें
नीचे दिए गए कारणों से RSI हिडन डाइवर्जेंस (बुलिश और बेयरिश) ट्रेड करने का सबसे अच्छा तरीका है:
- व्यापार प्रवृत्ति की दिशा में होंगे
- पारंपरिक आरएसआई विचलन की तुलना में सफलता अनुपात बेहतर है
- अच्छा रिस्क-रिवार्ड एक प्रवृत्ति के रूप में उच्च स्तर पर जारी रह सकता है।
इमेज - RSI हिडन बुलिश और बेयरिश डायवर्जेंस
उपरोक्त छवि हिडन बुलिश और हिडन बियरिश डायवर्जेंस दोनों के गठन को दर्शाती है।
हम कुछ चार्ट देख सकते हैं जो इन छिपे हुए अंतरों को दिखाते हैं और हम परिणाम भी देखेंगे।
छवि - मारुति चार्ट हिडन बुलिश डाइवर्जेंस दिखा रहा है
छवि - सीएट लिमिटेड चार्ट हिडन बुलिश डायवर्जेंस दिखा रहा है
.इमेज - हिडन बियरिश डायवर्जेंस दिखाते हुए निफ्टी चार्ट
इमेज - यसबैंक चार्ट हिडन बियरिश डाइवर्जेंस दिखा रहा है
.
यदि आप उपरोक्त सभी चार्टों को देखते हैं, तो प्रवृत्ति की दिशा में छिपे हुए विचलन होते हैं। छुपे हुए डाइवर्जेंस के बाद ट्रेड करना सामान्य डायवर्जेंस पर ट्रेड करने की तुलना में एक अच्छा विचार है (कैंडलस्टिक कन्फर्मेशन या एमए कन्फर्मेशन आदि जैसी किसी अन्य पुष्टि के अलावा)।
मुझे उम्मीद है कि यह विस्तृत विवरण मदद करता है!
#Trading #tradingforex #tradingcards #tradinglife #tradingsignals #tradingcardgame #TradingView #tradingcard #tradingplan #TradingLifestyle #TradingRoom #tradingtips #tradingonline #tradingaccounts #tradingstrategy #tradingfloor #tradingpost #tradingforliving #tradingdesk #tradingstocks #tradingeducation #tradingaccount #tradingpins #tradingsetup #TradingMentor #tradingsystem #tradingsoftware #tradingsignal #TradingPlaces #tradingsync
#trending #trendingnow #trendingtopic #trendings #trendingdances #trendingfashion #trendingatsephora #Trendingtopics #trendingnews #trendingstyle #trendingmusic #trendingfoodies #trendingpost #Trendinghair #trendingmemes #trendingmakeup #trendingreach #trendingposts #trendingpku #trendingvideo #trendingph #trendingjewelry #TrendingArtist #trendingart #trendingworld #trendingpolkesma #trendingtopik #trendingitems #trendingnails #trendingstyles
#TradeTalk
#InvestmentIdeas
#StocksToWatch
#TradingTips
#MarketInsights
#TradingStrategies
#StockMarketNews
#InvestmentStrategy
#TradingEducation
#FinanceNews


Comments
Post a Comment